Learning how to read electric meters gives you direct control over how much energy you use and how much you pay for it. The meter tracks electricity in kilowatt‑hours (kWh), the same unit your utility uses to calculate monthly charges for homes and businesses. Whether your service is measured by an older dial‑type meter, a digital display, or a modern smart meter, being able to interpret the numbers on the face of the meter reveals clear patterns in your energy use.
Your meter is the official device that records how much electricity flows from the utility to your property between billing periods. By checking it regularly, you can follow trends over time, spot sudden jumps that may signal problems or waste, and confirm that your bill matches actual usage. The sections that follow walk through different meter types, step‑by‑step reading methods, simple calculations, and practical ways to turn those readings into smarter energy management and lower costs.
Understanding Electric Meters and KWh Measurement
Electric meters track how much energy you use, measured in kilowatt-hours (kWh). This unit shows how much power is used over time. One kWh equals 1,000 watts running for one hour. For instance, a 100-watt bulb used for 10 hours will consume 1 kWh. Knowing this makes it easier to read your meter and estimate your electricity cost.
Types of Electric Meters
Analog meters, often called dial or electromechanical meters, show total usage through rotating dials. These devices have been around for decades and are still found in older homes. They usually feature four or five round dials marked 0–9. Each dial spins in the opposite direction of the next. Inside, electromagnetic forces drive the movement based on how much electricity is used. The reading keeps increasing and never resets.
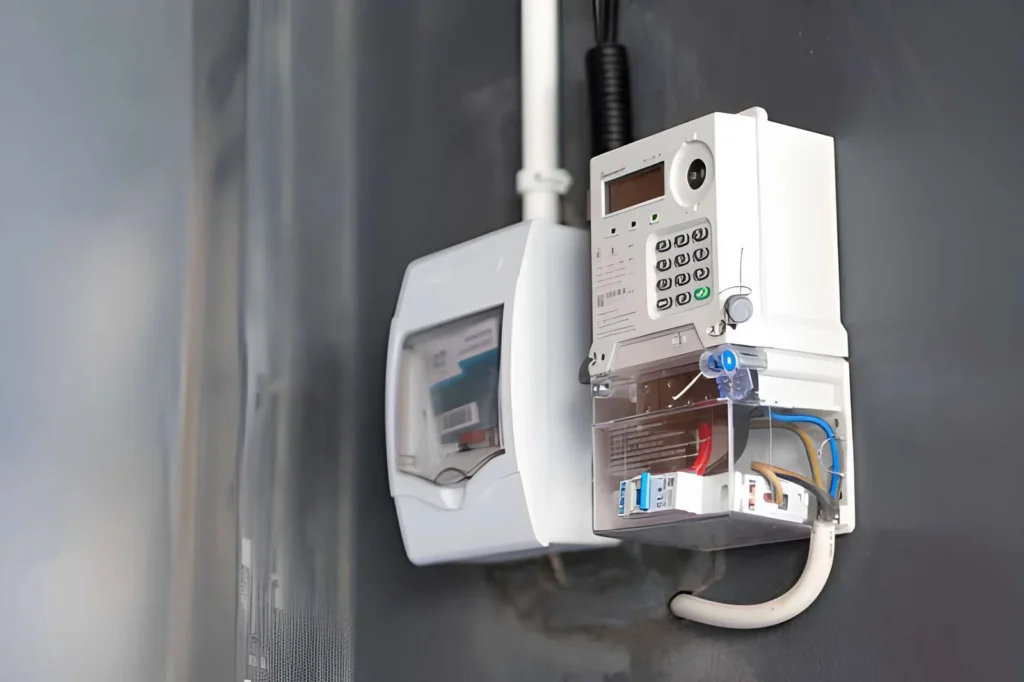
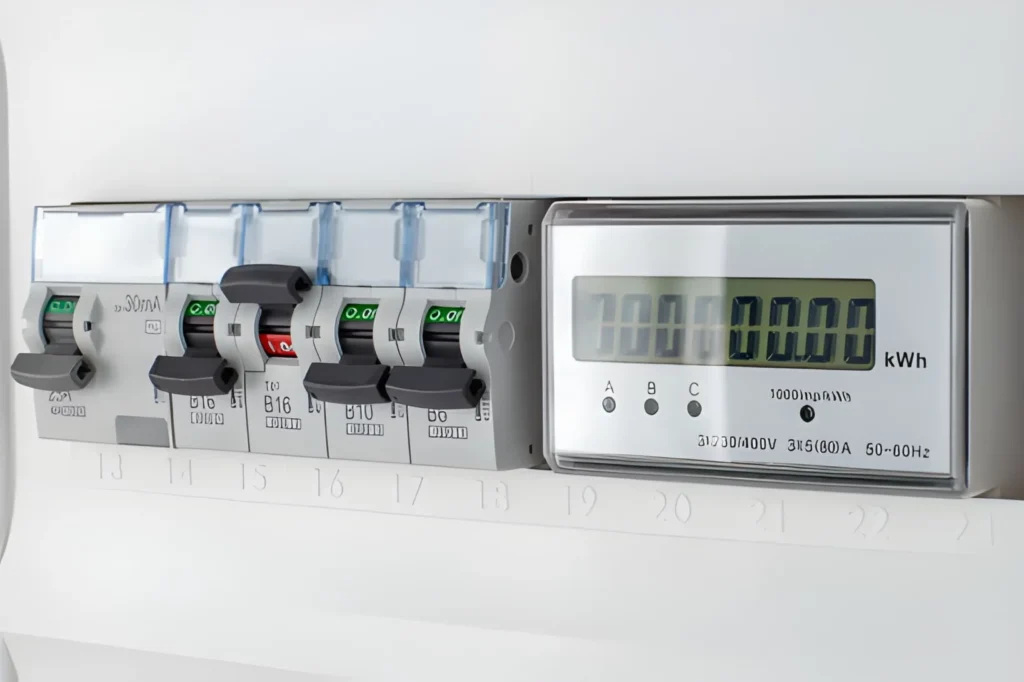
Digital meters present readings as numbers on a screen, removing the need to interpret dials. They are more precise than analog models and often display extra details like voltage or current usage. The screen updates regularly and shows total consumption since installation. Some units rotate through several displays, so you may need to wait or press a button to see the total kWh.
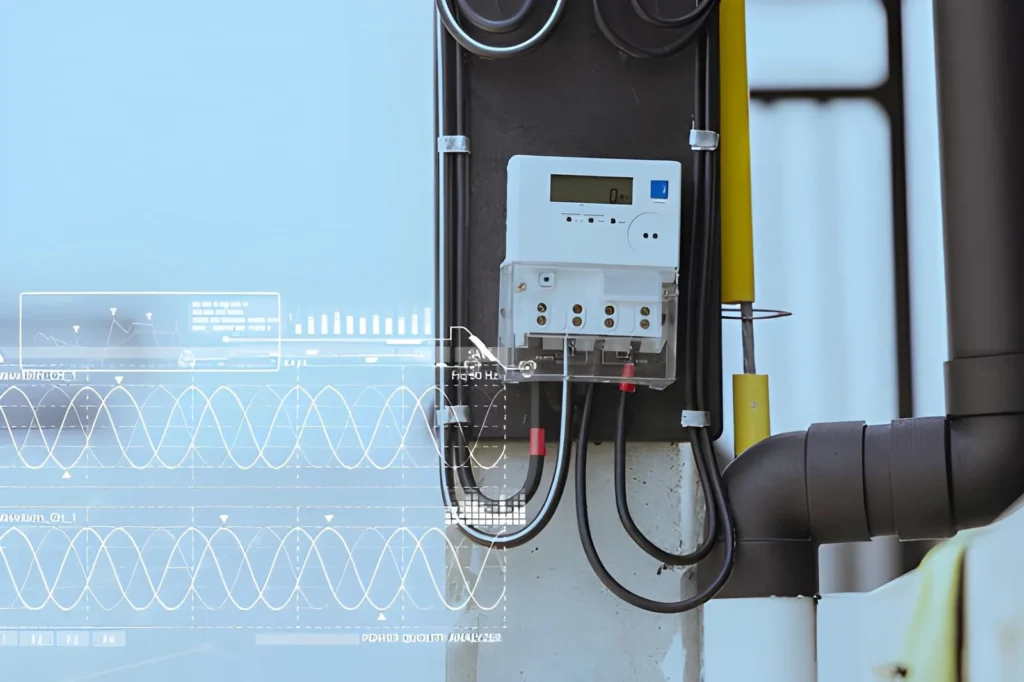
Smart meters are more advanced. They send usage data directly to the utility company, so no one needs to visit your home to read them. These meters support time-based pricing and give detailed usage reports through apps or online accounts. They look similar to digital meters but include wireless communication. This allows near real-time tracking and deeper insight into how electricity is used.
Locating Your Electric Meter
Most home meters sit outside, close to where power enters the building. Common spots include exterior walls near the electrical panel, beside the garage, or on a standalone post in the yard. In apartments, meters are often grouped together in a shared area, each labeled for a specific unit.
If you cannot find yours, check where the power lines connect to your home. The meter is installed along that path, usually near the main panel. You can also match the meter number on your bill with the label on the device to confirm you have the correct one.
How to Read Analog Electric Meters
Reading an analog meter may look tricky at first, but it becomes simple once you understand how the dials work and follow a clear method.
Dial Layout and Movement
Analog meters usually have four or five dials lined up in a row. Each dial shows a different place value, starting from single units on the right and increasing to tens, hundreds, and more as you move left.
The key detail is that each dial turns in the opposite direction of the one next to it. One spins clockwise, the next counterclockwise, and so on. This pattern comes from the internal gear system.
Each dial is labeled from 0 to 9. A pointer shows the current number. Pay close attention to the direction of rotation, since reading it the wrong way will give the wrong result.
Step-by-Step Reading Method
Start with the leftmost dial and move to the right, one dial at a time. For each dial, note the number the pointer has already passed.
If the pointer sits between two numbers, always choose the lower one. This rule keeps your reading accurate.
If the pointer looks like it is exactly on a number, check the dial to the right. If that next dial has already passed zero, record the number you see. If it has not reached zero yet, write down the lower number instead.
For example, if the dials read 4, 7, 3, 6, and 2 from left to right (with each pointer just past those numbers), the total reading is 47,362 kWh. If a pointer appears to sit on 5 but the next dial is still before 0, you should record 4, not 5.
Common Mistakes to Watch For
Choosing the higher number when the pointer is between two digits; always pick the lower one.
Ignoring the alternating rotation of dials, which can lead to misreading values.
Misreading pointers that appear to sit exactly on a number without checking the next dial.
Rushing through the process without verifying each dial carefully.
Taking your time and checking each dial step by step will help you avoid errors and get a correct reading.
How to Read Digital and Electronic Electric Meters
Digital meters make reading your usage easier by showing numbers directly on a screen instead of dials.
Reading Digital Meter Displays
Most digital meters show your total energy use as a string of 5 to 7 digits on an LCD or LED screen, for example 47362. This number is the total kilowatt-hours used since the meter was installed. Some models also show a decimal point for partial kWh, but utilities usually bill using only whole kWh and may ignore or round the decimal part.
You will often see the unit “kWh” or “KWH” next to the number, which confirms you are looking at total energy consumption. If the screen shows “kW” instead, that value represents your current power demand at that moment, not your total usage. Other screens may list values like maximum demand, power factor, or voltage, but the total kWh reading is the main figure you need for tracking usage and estimating your bill.
Navigating Meters with Multiple Screens
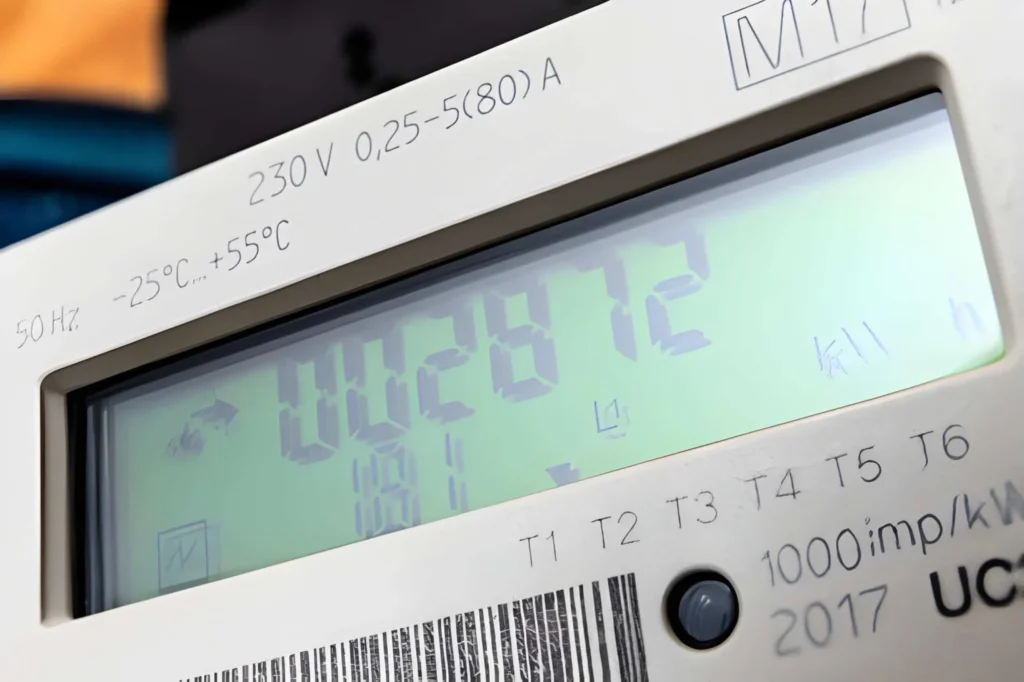
Many newer digital meters rotate through several screens automatically, or let you move between them with a button. These screens can show total usage, present demand, separate time-of-use registers, voltage, and internal diagnostic data. The display often changes every few seconds, and pressing a button usually moves you to the next screen.
Look for words or short codes on each screen that explain what you are seeing. Labels like “TOTAL KWH” usually mark your overall consumption, while “KW” or “DEMAND” indicate your present draw. Codes such as “R1,” “R2,” and similar register numbers are often used for different time-of-use periods like peak, off-peak, or shoulder hours. Your utility bill or meter guide will explain which registers to record and how they match the price periods on your rate plan.
Understanding Symbols and Status Indicators
Digital and smart meters use icons to show their status and help you understand whether they are working normally. A lightning bolt symbol or moving bars often means power is flowing through the meter right now. Other icons may show that the meter is in standard operation mode, has detected tampering, or has logged an internal error.
Smart meters can also display communication symbols that show if they are connected to the utility’s network and how strong the signal is. Some units include a battery icon for the internal backup battery, which keeps the clock and stored data during power outages; a low-battery warning means the meter or battery may need service. If you see error codes, flashing warning symbols, or any display you do not understand, check the meter manual or contact your power company for help.
Reading and Understanding Smart Meters
Smart meters show your energy use like traditional meters but also add remote reading, detailed data, and online tools that help you track and manage consumption more closely.
Reading the Physical Smart Meter
Most smart meters have a digital screen that shows total kWh used, similar to any other electronic meter. To read it, wait for or cycle to the screen labeled with “kWh,” “TOTAL KWH,” or similar wording, then write down the digits from left to right, ignoring any decimals. Many models scroll through several screens on a loop, including current demand, total usage, and sometimes date, time, or rate information.
Some smart meters include buttons (often labeled A, B, or “display”) that let you move between screens manually. The cumulative kWh value is still the key figure you need to confirm your bill and track long-term usage. Even though the meter automatically sends data to your utility, knowing how to read this physical display means you can still check your usage if you do not have internet or app access.
Using Online Portals and Apps
The main benefit of a smart meter is access to detailed data through your utility’s online account or mobile app. After creating or logging into your account with your utility credentials, you can usually see charts of hourly, daily, monthly, and yearly kWh usage. Many sites allow you to download this information as a spreadsheet, compare different time periods, and set alerts when your usage or estimated costs pass a chosen level.
This detailed view helps you spot patterns such as when your usage peaks during the day, how weekends differ from weekdays, or how new appliances or efficiency changes affect your consumption. Some utilities also show how your home compares to similar households, giving you context for whether your usage is low, average, or high.
Smart Meter Features and Capabilities
Smart meters support time-of-use pricing, where electricity costs more during busy hours and less during off-peak times. The meter automatically tracks how much energy you use in each period so your bill can apply the correct rate for peak, shoulder, and off-peak usage. By shifting flexible activities such as laundry or EV charging to cheaper times, you can lower your overall bill.
More advanced features include remote connection or disconnection of service, voltage and power quality monitoring, and automatic outage reporting that helps utilities restore power faster. Some smart meters or related devices integrate with home energy management systems, allowing automated actions based on prices or usage targets, such as adjusting thermostats or delaying appliance operation. Together, these capabilities give both you and your utility better control and insight into how and when electricity is used.
Calculating Electricity Consumption and Costs
Knowing how to work from meter readings to kWh and then to dollars helps you check your bills and understand where your money is going.
Computing Consumption Between Readings
To find how much electricity you used in a period, subtract the earlier reading from the later reading. The result is your usage in kilowatt-hours for that interval. For example, if your previous reading was 45,280 kWh and your new reading is 45,892 kWh, your use is 612 kWh because 45,892 − 45,280 = 612. This same subtraction works whether your meter is analog, digital, or smart, as long as both readings come from the same meter.
For clean daily or weekly tracking, read the meter at the same time each day or week to keep intervals consistent. For month-to-month comparisons, taking a reading on the same calendar day each month makes the numbers easier to compare, even though months differ slightly in length.
Estimating Electricity Costs
To estimate your energy charge, multiply your kWh usage by your rate per kWh. Current U.S. residential rates usually fall somewhere between about 0.10 and 0.30 dollars per kWh depending on the state, with recent national averages around 0.16–0.18 dollars per kWh. Using the earlier example, if you used 612 kWh at 0.14 dollars per kWh, your estimated energy cost would be 612 × 0.14 = 85.68 dollars.
Most bills are more complex than this simple multiplication because many utilities use tiered pricing that raises the rate after you pass certain usage levels. Others use time-of-use pricing, where peak hours cost more and off-peak hours cost less. On top of that, fixed fees, delivery charges, and taxes can add roughly 20–50 percent above the basic energy charge, depending on your utility and local rules.
Understanding Your Electric Bill Components
An electric bill is usually made up of several pieces that together form the total amount due. The main parts are:
Bill item
What it covers
Typical range (residential)
Energy charge
Cost of kWh you used
About 0.10–0.30 dollars per kWh, by state
Customer/basic charge
Fixed monthly fee for service and billing
Around 5–25 dollars per month, varies by utility
Distribution charge
Local wires, transformers, poles, and maintenance
Often 0.02–0.08 dollars per kWh or mixed fixed/variable parts
Transmission charge
High‑voltage grid that moves power long distances
Often 0.01–0.04 dollars per kWh or similar demand-based charge
Taxes and surcharges
Government taxes and public benefit programs
Commonly about 5–15 percent of the total bill
The energy charge is based on your kWh usage and the applicable rate or rates on your plan. The customer charge is fixed and appears even if you use no electricity that month. Distribution and transmission items pay for the grid that delivers power to your home, while extra line items may fund renewable programs, grid upgrades, or other regulatory requirements. Taxes depend on local laws and can include state sales tax, city utility tax, and other mandated fees.
Monitoring and Tracking Electricity Consumption
Regular tracking of your electricity use helps you spot patterns, control costs, and catch problems early.
Setting a Reading Schedule
Daily readings give the most detail, showing how usage changes from day to day. Reading your meter at the same time each day avoids confusion from different interval lengths; many people choose early morning or late evening for consistency. Weekly readings are easier to maintain and still reveal trends if you always check the meter at the same time on the same day, such as Sunday evening. Monthly readings line up with billing cycles and are useful for checking your bill and following long‑term trends; taking a reading right before or after the utility’s billing read makes comparison simple.
Recording and Organizing Data
Keep a log of dates and meter readings so you can calculate usage between each entry. A paper notebook works, but a simple spreadsheet can automatically subtract the previous reading from the current one, graph your usage, and help you add notes about weather or unusual activity. Add columns for date, meter reading, kWh used since the last reading, and brief comments such as “heat wave,” “guests visiting,” or “laundry day.” Clear records make it easier to see patterns and quickly spot days or weeks that look out of line.
Best Practices for Nightly Meter Checks
Taking your reading at the same time every evening, for example 9:00 p.m., gives you a consistent 24‑hour window for each data point. Each night, note the new meter reading and subtract yesterday’s reading to find that day’s kWh use. Many typical U.S. homes fall somewhere around 20–30 kWh per day on average, with smaller or very efficient homes using less and large or high‑usage homes sometimes reaching 35–40 kWh or more. Higher‑than‑usual days often line up with very hot or cold weather, heavy appliance use, or special activities; unexplained spikes may point to faulty equipment or something left running.
Using Electricity Consumption Monitors
Plug‑in electricity monitors measure the usage of a single device or appliance. You plug the monitor into the wall, plug the appliance into the monitor, and it shows real‑time watts and total kWh used over time, often on an easy‑to‑read display. Devices like Kill A Watt‑type meters usually cost around 20–40 dollars and help you uncover “phantom loads” from electronics that draw power even when in standby.
Whole‑home energy monitors install near or inside your electrical panel and track total household use in real time. They often use clamp‑on sensors around the main service wires, then send live data to a display or phone app so you can see how usage jumps when major appliances turn on. Some advanced systems can even recognize the unique electrical “signature” of individual devices, breaking down your use by appliance and helping you find the best opportunities to save.
Interpreting High Electric Meter Readings
When your meter shows much higher usage than normal, it is important to figure out why before the extra use turns into repeated high bills.
What Counts as a High Reading
Recent national data shows that the average U.S. home uses roughly 855–900 kWh per month, or about 28–30 kWh per day, though this varies widely by region and home type. Homes in hotter southern states often use well over 1,200 kWh per month because of heavy air‑conditioning, while homes in milder climates may use closer to 600–900 kWh monthly. Your own “high” usage is best judged against your normal pattern: if you usually use around 800 kWh but suddenly see 1,200 kWh with no clear reason, that deserves a closer look. Daily usage that repeatedly runs 20 percent or more above your past average is another warning sign of changed behavior, a new load, or a developing problem. Seasonal swings are expected, with summer and winter often higher than spring and fall, but year‑over‑year jumps that cannot be explained by rate changes or known lifestyle shifts should be investigated.
Common Reasons for High Consumption
Heating and cooling together make up more than a third to about half of household energy use in many homes, so problems here can cause big increases. Dirty filters, low refrigerant, failing parts, or thermostat settings that are too extreme can all make HVAC systems run longer and use much more power than usual. Water heating is another major load, often accounting for roughly 10–18 percent of a home’s energy use. Very high temperature settings, sediment buildup in tank heaters, poor insulation, or hot‑water leaks can all push consumption higher.
Large appliances such as refrigerators, clothes dryers, and older freezers can also drive up usage. An older refrigerator can use several times as much energy as a newer efficient model, especially if door seals are worn or the unit runs hot. Clogged dryer vents, heavy laundry loads, or frequent use of space heaters and portable air conditioners are other common contributors to higher‑than‑normal readings.
How to Investigate Usage Spikes
When you see an unexpected spike, start by confirming the basics. Reread the meter carefully to rule out reading errors and make sure you are subtracting the correct previous reading over the right billing period. Check whether that bill covers more days than usual, since a longer billing window alone can raise total kWh noticeably.
Next, think about what changed during that time. Look for extreme weather, guests staying over, more time at home, extra laundry or cooking, or new devices such as an additional freezer or space heater. If nothing obvious stands out, perform a basic circuit or appliance audit: turn off as many breakers as you safely can, then bring them back on one by one while watching the meter to see which circuits cause large jumps in usage. If the meter still turns when everything should be off, or if one circuit shows unusually high draw, you may have a wiring problem, a hidden load, or a faulty device that needs professional attention.
How Electricity Companies Read Meters
Utilities use several methods to collect meter readings, each with different costs, accuracy levels, and chances for error.
Manual Meter Reading
In traditional setups, utility employees visit properties in person to read and record meter values. They usually follow fixed routes, gathering hundreds of readings per day with handheld devices or paper forms. Because people are involved at every step, mistakes can occur—dials may be misread, digits can be transposed, or a reading might be recorded for the wrong meter in a multi‑meter location.
Most companies read meters monthly, though some bill every other month and estimate in between. Reading dates are generally consistent but may shift a few days due to weekends or route planning. Your bill will show the prior and current read dates and usually mark whether the read was “actual” or “estimated.”
Automated Meter Reading (AMR)
Automated meter reading systems collect meter data remotely so workers do not need to inspect each meter visually. In drive‑by AMR, meters send radio signals that are captured by receivers in passing utility vehicles; walk‑by systems work the same way but with people on foot. These approaches cut labor time and reduce errors from manually writing or typing readings.
Fixed‑network AMR installs permanent receivers around the service area that automatically gather readings from nearby meters at set intervals. This allows daily or even more frequent data collection and greatly reduces the chance of recording errors, though technical problems, communication failures, or device malfunctions can still disrupt data flow.
Smart Meter Communication
Smart meters use two‑way communication technologies such as cellular networks, radio‑frequency mesh, or power‑line communication to send detailed usage data back to the utility. They transmit readings at programmed intervals—often hourly or more frequently—giving utilities near real‑time insight into consumption. The two‑way link also lets utilities update meter settings, push firmware upgrades, detect outages or tampering, and apply time‑varying prices without visiting the site.
This automation largely removes traditional reading errors and reduces the cost of field visits. Customers benefit through more accurate bills, fewer estimates, more detailed usage information, and faster detection of service issues, though all of this depends on the communication network working properly. When networks fail or meters lose connection, utilities may temporarily fall back on estimates or manual reads until the problem is fixed.
Estimated Readings and Corrections
If the utility cannot obtain an actual reading—because of access issues, equipment faults, or data problems—it will often issue an estimated bill. These estimates typically rely on your past usage for similar months or the same period in earlier years, sometimes adjusted for expected weather or known changes. Bills usually mark these values with labels like “E,” “EST,” or “Estimated” so you can tell they are not based on a fresh meter read.
Once an actual reading is captured again, the utility “true‑ups” your account by comparing the estimate with your real usage and adjusting the next bill accordingly. If prior estimates were low, you may see a larger catch‑up bill; if they were high, you should receive a credit. Many utilities let customers submit their own readings by phone, website, or app, which can reduce reliance on estimates and help correct errors more quickly when you suspect something is wrong.
Verifying Billing Accuracy and Resolving Discrepancies
Checking your bill against your meter helps ensure you only pay for the electricity you actually use.
Comparing Bill to Meter Reading
Your bill lists the previous and current meter readings used to calculate your kWh usage, along with the read dates. First, confirm that the meter number and readings on the bill match the physical meter at your home, allowing for small timing differences. If you keep your own log, compare the readings you recorded near the billing dates to those printed on the bill; minor differences of a few kWh are normal, but large gaps deserve attention.
Recalculate usage yourself by subtracting the previous reading from the current reading and make sure that result matches the kWh listed on the bill. Check the billing period length as well—most “monthly” bills cover roughly 28–32 days, depending on the utility’s schedule. If the period is much shorter or longer, note that this alone can raise or lower total kWh compared with other months.
Common Billing Errors
Errors sometimes arise from incorrect meter readings, such as misread dials, swapped digits, or values recorded for the wrong meter. For example, a reading of 47,362 accidentally entered as 47,632 makes one bill look low and can cause a later “catch‑up” bill when the mistake is corrected. Problems can also occur when estimated readings are used during access or data issues and do not reflect actual use, leading to under‑ or over‑billing until a real reading is taken.
Other common issues involve incorrect rates or plan details. These include billing on the wrong tariff, applying time‑of‑use prices to the wrong hours, or misapplying fixed‑rate vs. variable‑rate plans. Although modern billing systems reduce simple math mistakes, it is still wise to verify that the rate per kWh on the bill matches your contract and that multiplying kWh by that rate gives the expected energy charge.
Disputing Bills and Requesting Adjustments
If you spot a discrepancy, contact your utility’s customer service promptly and explain exactly what looks wrong. Have your account number, the bill in question, and your own meter readings or notes ready to support your case. Most utilities will review the account, check their records, and, if needed, send someone to reread the meter and correct the bill if an error is confirmed.
Keep a record of all contacts—dates, names, and what was discussed—in case the issue needs escalation. If the first response does not solve the problem, ask for a supervisor or use the utility’s formal dispute process; if that still fails, you can usually bring the matter to your state or local utility regulator, which has procedures for handling billing complaints.
For larger or ongoing discrepancies that might indicate a faulty meter, you can request a meter accuracy test. Utilities typically perform such tests under defined rules; sometimes there is a fee that is waived if the meter is found to be outside allowed accuracy limits. If the meter passes, you will generally be responsible for the billed usage; if it fails, the utility should adjust past bills based on estimated true consumption and replace or repair the meter.
Using Meter Data to Reduce Electricity Costs
Meter readings turn into real savings when you use them to spot patterns, test changes, and then lock in what works.
Finding Energy-Saving Opportunities
Study your daily or hourly kWh to see when usage is highest and what might be running at those times. Compare mornings, evenings, weekdays, weekends, and seasons to see whether peaks line up with cooking, entertainment, heating, cooling, or other specific activities. Nighttime “baseline” usage helps reveal always‑on devices and phantom loads, such as electronics, cable boxes, and network gear that draw power 24/7.
Use your meter as a measuring tool for experiments. For example, lower your thermostat by a couple of degrees for a week and compare average daily kWh with a similar week at the higher setting. Try unplugging idle devices, changing water‑heater settings, or adjusting schedules for major appliances, then check whether the meter data confirms real reductions rather than guessed savings.
Putting Reduction Strategies into Practice
Behavior changes can cut usage right away with no upfront cost. Seasonally adjusting thermostats, switching off lights in empty rooms, and using daylight where possible all reduce load, while replacing remaining incandescent bulbs with LEDs can cut lighting energy use by about 75–80 percent. Running dishwashers and clothes washers only with full loads, choosing cold‑water cycles, and air‑drying dishes or clothes further trims everyday consumption.
Equipment upgrades go further but require investment. Swapping older appliances for Energy Star certified models can reduce the energy those devices use by roughly 10–50 percent, depending on the type and age of the equipment being replaced. Adding insulation, sealing drafts, upgrading windows, installing high‑efficiency HVAC systems, and using programmable or smart thermostats all show up clearly in long‑term meter data as lower heating and cooling demand.
Using Time-of-Use Rates to Your Advantage
If you are on a time‑of‑use plan, your meter or smart‑meter portal will show how much energy you use in each rate period. Shifting flexible tasks—like doing laundry, running the dishwasher, or charging an EV—from expensive peak hours to cheaper off‑peak times can noticeably reduce your bill. Pre‑cooling or pre‑heating your home in off‑peak windows and then maintaining temperature during peaks with minimal HVAC runtime is another effective tactic.
Use your interval data to estimate how much of your usage occurs at peak vs. off‑peak rates and what you could save by moving some of it. Analyses suggest that if you can shift around 20 percent or more of your annual use to lower‑priced hours on a well‑designed time‑of‑use plan, you may cut your overall bill by roughly 10–30 percent, depending on the price differences and your habits.
The Core Difference: Single Phase vs. Three Phase Meters When choosing between a single phase and a three phase energy meter, the voltage, load capacity, and power delivery method are key factors. Voltage and Load Capacity Meter Type Voltage Range Typical Load Capacity Application Single Phase Meter 110V – 230V Low to medium residential loads […]
Have you been hearing more about smart meters at industry events or from your suppliers lately? If you’re considering an upgrade or a first-time installation, you’re in the right place. In the fast-evolving world of industrial energy management, understanding smart meters is not just smart—it’s essential. Let’s break down what smart meters are, how they […]
Smart Energy Meter Overview Discover the Liuyi eSmart Energy Meter — your reliable digital electricity meter designed for modern homes. Stay in control of your energy with: This WiFi smart energy monitor offers a simple way to manage your energy use, making it the perfect energy-saving device for any household. Key Features & Benefits of […]
We use cookies to enhance your browsing experience, serve personalised ads or content, and analyse our traffic. By clicking "Accept All", you consent to our use of cookies.